
Why lifecycle policy and pixel flow matter more than view creation
I had 47 lines of logs showing successful initialization. I had zero pixels on screen. The gap between those two facts cost us three days.
I was embedding a real-time 3D rendering engine into an Android UI. The surface was created. The service was connected. The camera state was applied. Every callback fired exactly when it should. No crashes. No errors. Just a perfectly blank screen and a stack of logs that insisted everything was fine.
That’s when it became clear: I was asking the wrong question.
The Wrong Question
For three days, I kept asking:
“Is the view ready?”
I checked creation callbacks. I verified lifecycle states. I added more logging to prove the TextureView existed, the surface was valid, and the engine had been notified. Every checkpoint came back green.
But the screen stayed blank.
The Right Question
What I should have been asking:
“Are pixels actually arriving?”
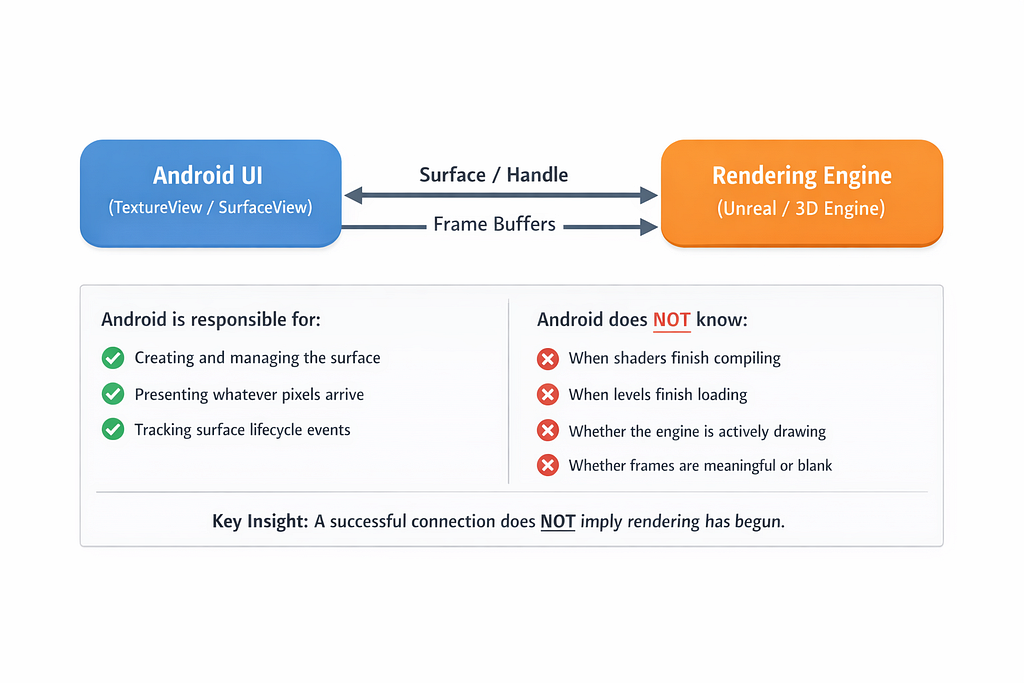
This distinction matters more than it sounds. On Android, a rendering surface is just a presentation target — a buffer where pixels can land. Android can allocate that buffer, manage its lifecycle, and composite whatever arrives. But Android cannot force an external rendering engine to start producing frames.
The engine and the platform have to shake hands, and that handshake has more steps than you’d think.
Understanding the Contract
When you integrate an external renderer (Unreal Engine, Unity, a custom OpenGL pipeline), the relationship looks like this:
ANDROID SIDE:
1. Creates TextureView
2. Allocates SurfaceTexture when ready
3. Provides Surface handle to engine
4. Waits for frames to arrive
5. Composites received frames to screen

ENGINE SIDE:
1. Receives Surface handle
2. Binds rendering context to that surface
3. Initializes rendering pipeline
4. Starts producing frames
5. Pushes pixels to the surface buffer
Here’s the critical insight: a successful connection does not guarantee rendering has begun.
Android completing steps 1–3 doesn’t mean the engine will complete steps 3–5. The engine might be waiting for resources to load. It might be stalled on a background thread. It might think the surface is invalid. Or — most insidiously — it might have started rendering to a previous surface that no longer exists.
I was measuring the handshake. I wasn’t measuring the pixel flow.
What Healthy vs. Broken Actually Looks Like
Once I started measuring frame arrival and content visibility, I saw two very different realities:
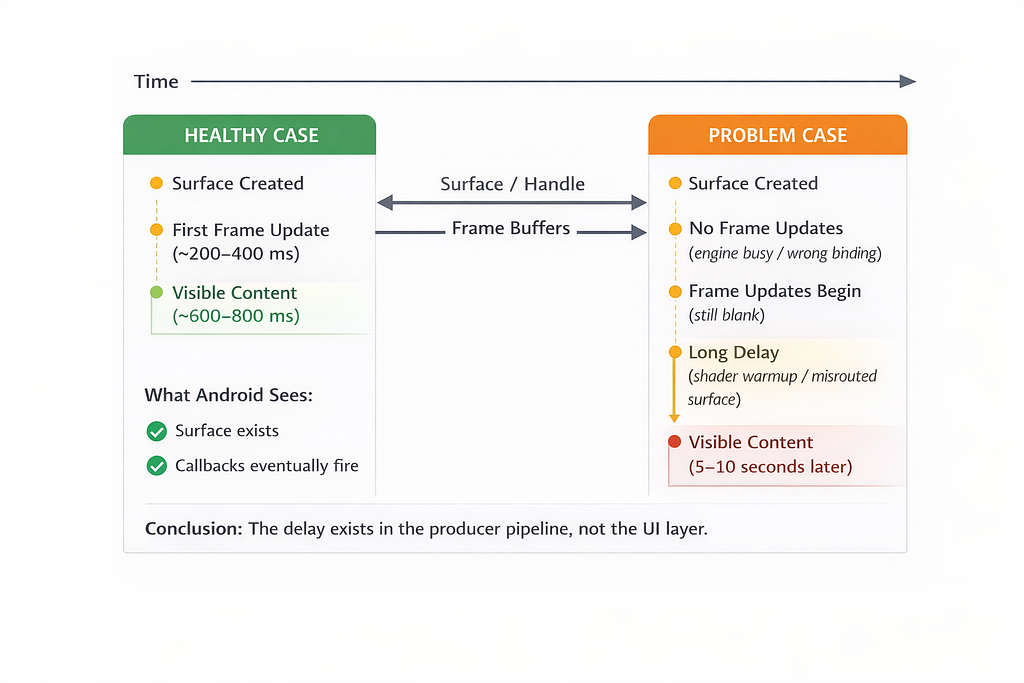
The difference? In the broken case, the engine never started rendering — or started rendering to the wrong surface.
The Lifecycle Multiplier
Then came the second realization.
The blank screen didn’t happen consistently. It happened after navigation.
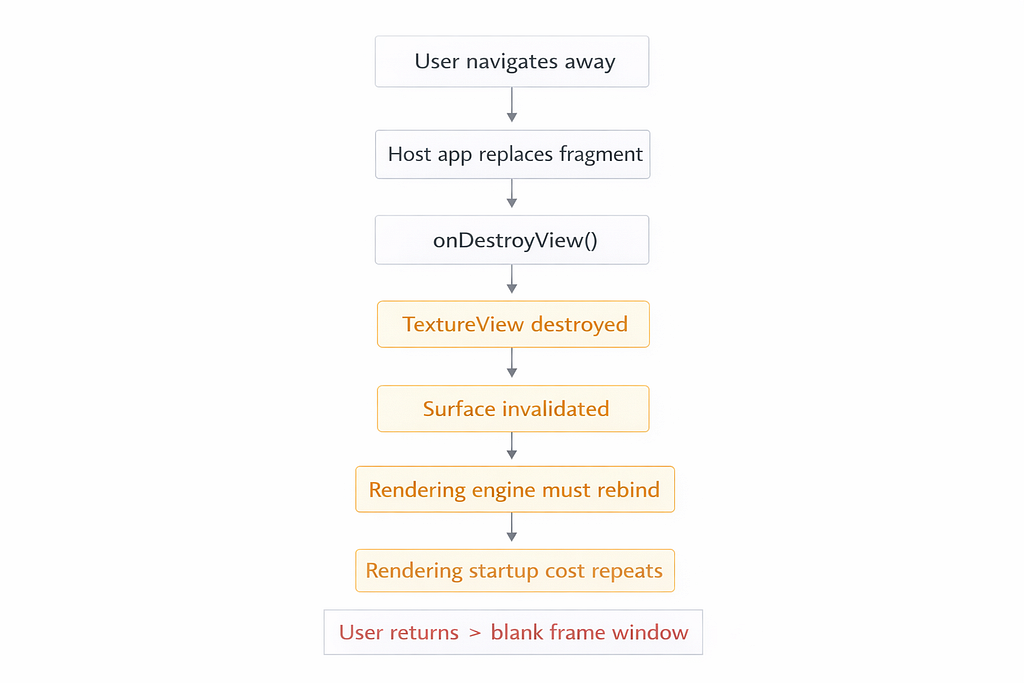
When you navigate away from a Fragment containing a TextureView, Android destroys the view hierarchy. The TextureView is detached, and its surface becomes invalid. When you navigate back, a new TextureView is created with a new surface, and the engine must rebind.
If the engine doesn’t handle this rebinding correctly — or if there’s a race between surface destruction and engine notification — you end up rendering to a ghost surface. The engine thinks it’s rendering. Android has nothing to show.
Lifecycle policy, it turned out, dominated the user experience.
A Pattern You Can Use Today
What I needed was simple: measure reality, not assumptions.
Below is a small, safe pattern you can use in any Android app to answer:
- Did a surface get created?
- Did frame updates start arriving?
- Did meaningful pixels actually show up?
- Am I churning surfaces due to lifecycle events?
1. A centralized monitor interface
interface RenderMonitor {
    fun onTextureViewCreated(feature: String, viewId: Int)
    fun onSurfaceAvailable(feature: String, surfaceId: Int, w: Int, h: Int)
    fun onReadySentToEngine(feature: String, surfaceId: Int)
    fun onFrameUpdate(feature: String, surfaceId: Int, updates: Long)
    fun onContentDetected(feature: String, surfaceId: Int, delayMs: Long)
    fun onSurfaceDestroyed(feature: String, surfaceId: Int)
}
This interface is reusable across any feature that embeds external rendering.
2. A simple log-based implementation
class LogRenderMonitor(private val tag: String = "UE-Render") : RenderMonitor {
    private fun log(feature: String, msg: String) =
        android.util.Log.d(tag, "[$feature] $msg")

    override fun onTextureViewCreated(feature: String, viewId: Int) =
        log(feature, "TextureView created. viewId=$viewId")

    override fun onSurfaceAvailable(feature: String, surfaceId: Int, w: Int, h: Int) =
        log(feature, "Surface available. surfaceId=$surfaceId size=${w}x$h")

    override fun onReadySentToEngine(feature: String, surfaceId: Int) =
        log(feature, "onReady -> engine notified. surfaceId=$surfaceId")

    override fun onFrameUpdate(feature: String, surfaceId: Int, updates: Long) =
        log(feature, "Frame update. surfaceId=$surfaceId updates=$updates")

    override fun onContentDetected(feature: String, surfaceId: Int, delayMs: Long) =
        log(feature, "CONTENT DETECTED. surfaceId=$surfaceId delayMs=$delayMs")

    override fun onSurfaceDestroyed(feature: String, surfaceId: Int) =
        log(feature, "Surface destroyed. surfaceId=$surfaceId")
}
Start with logging. Swap in your metrics pipeline later.
3. The Compose wrapper (reusable across features)
https://gist.github.com/rohithgdm/23eb021adf9f0e01443bef2bc968e70e
A note on the bitmap sampling: This runs on the main thread and allocates memory. The updates % 10L throttle keeps it lightweight, but for production you might throttle more aggressively or move sampling to a background thread using PixelCopy.request() when you have window access. The key idea is sampling occasionally—not every frame.
📝 Note on Production Usage
The bitmap sampling approach shown here is intentionally simple for educational purposes. In production systems, consider:
- Using PixelCopy.request() with a background thread when you have Window access
- Implementing more aggressive throttling (every 30–50 frames instead of 10)
- Adding timeout detection (if no content after N seconds, trigger fallback)
- Integrating with your existing observability pipeline (DataDog, Firebase, custom metrics)
What This Gives You
With this pattern in place, you can conclusively answer:
✓ Was the surface created?
✓ Did frame updates start (updates > 0)?
✓ How long until the first meaningful pixel appeared?
✓ Are we recreating surfaces frequently due to lifecycle churn?
It turns opinions into measurable facts. When someone says “the engine is working fine,” you can reply with: “The engine was notified 800ms ago and I’ve received zero frame updates.”
That’s a different conversation.
References & Further Reading
Android Framework Documentation:
- TextureView — Official Android documentation on TextureView and surface lifecycle
- Graphics Architecture — Deep dive into Android’s graphics pipeline and BufferQueue mechanism
- AndroidView in Compose
External Rendering Integration:
- Unreal Engine Android Development — Epic Games official documentation
- Graphics Architecture — BufferQueue — Understanding Android’s producer-consumer rendering model
Related Articles:
- The Speedometer Lied: Debugging Real-Time IPC in Android Automotive — Deep dive into Binder IPC performance debugging in AAOS
The Takeaway
“Connected” does not mean “rendering.” Android can present pixels, but it cannot create them. The contract between platform and engine is more fragile than most APIs I work with daily, and lifecycle policy can dominate the entire user experience.
A small amount of observability prevents weeks of blame and guesswork.
The next time you see a blank screen with healthy logs, resist the urge to add more logging to the handshake. Instead, measure the pixel flow. The answer might surprise you — and it will definitely save you time.
Have you hit this issue? What did you end up measuring? I’d love to hear your war stories in the comments.
The Day “Connected” Didn’t Mean “Rendering” was originally published in ProAndroidDev on Medium, where people are continuing the conversation by highlighting and responding to this story.


This Post Has 0 Comments