
Android Automotive System Internals — Part 1: Binder IPC & the Return-Path Latency Problem that Shouldn’t Exist
Picture this: a test vehicle on the proving ground, accelerating smoothly through a validation run. Everything feels right — but the digital speedometer on the instrument cluster is frozen, stubbornly displaying 35 mph while the car surges forward. A few seconds pass. Still 35. The vehicle is clearly moving faster, but the display has stopped caring.
This isn’t a hypothetical. It’s a scenario that surfaces repeatedly in Android Automotive OS (AAOS) development — a frozen or stale gauge reading that defies easy explanation because every individual component, when checked in isolation, appears to be working correctly. The sensor is publishing. The service is running. The app is subscribed. And yet: 35 mph, going nowhere.
Working in this space, this class of problem comes up more than you’d expect. It’s rarely a single obvious failure. It’s almost always a timing issue buried inside Android’s multi-layer IPC chain — and tracing it forces you to understand the architecture at a level most developers never need to reach.
What follows is a structured walkthrough of exactly that investigation: following a vehicle speed reading from physical sensor to UI, understanding where latency accumulates, and building a mental model that applies to any real-time property in AAOS.
The speedometer is just the symptom. The real story is about why Android’s Binder IPC, brilliant for traditional Android, creates fundamental challenges for automotive use cases.
Why AAOS IPC Is Architecturally Different
Before diving into the debugging, let’s establish why this problem is uniquely automotive.
In a typical Android app, IPC delays are annoying but rarely critical. A 200ms delay in loading a notification? The user won’t notice. But in a car traveling at 70 mph, a 200ms speedometer lag means you’re displaying a speed from 20 feet ago. For safety-critical UIs — speedometers, collision warnings, battery state in EVs — latency isn’t just a performance metric. It’s a correctness issue.
AAOS inherits Android’s security model: apps are sandboxed, system services mediate hardware access, and everything flows through Binder IPC. This creates a fundamental tension:
- Android’s design goal: Isolate apps from hardware to prevent malicious access
- Automotive’s requirement: Stream sensor data at 10–100 Hz with minimal latency
The result? A multi-layer IPC chain where each hop adds latency, thread scheduling uncertainty, and potential bottlenecks. Understanding this chain isn’t optional for automotive platform engineers — it’s the foundation of performance debugging.
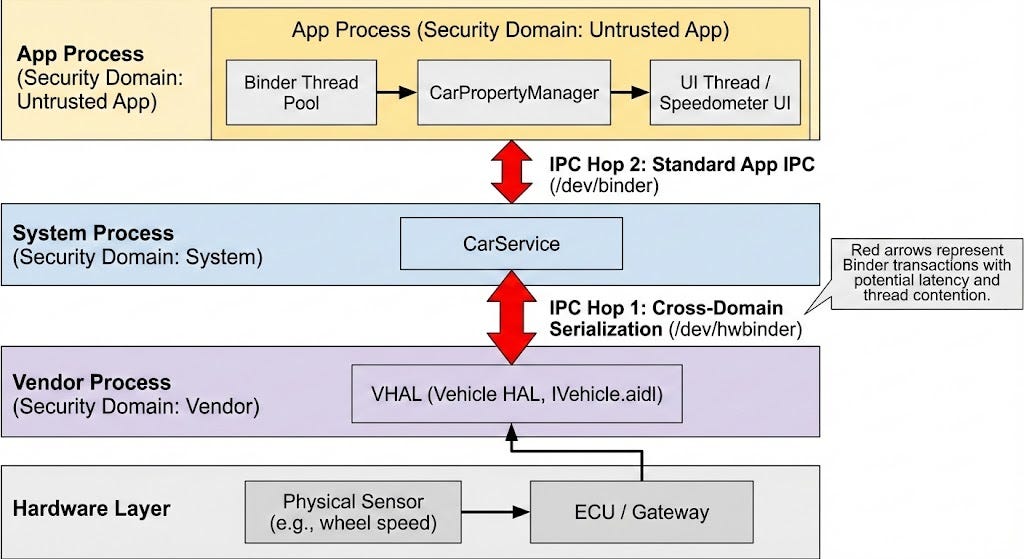
Here’s the complete data flow for a simple vehicle property like speed:
Following the Data Trail
Let me show you how I debugged this, layer by layer.
Layer 1: The App (Instrument Cluster)
Our speedometer app uses Android’s Car API to access vehicle data. The code looked correct:
// ClusterActivity.kt - This is where we EXPECTED updates...
val carPropertyManager = car.getCarManager(Car.PROPERTY_SERVICE) as CarPropertyManager

carPropertyManager.registerCallback(object : CarPropertyEventCallback() {
    override fun onChangeEvent(value: CarPropertyValue<*>) {
        val timestamp = System.currentTimeMillis()
        val speed = value.value as Float
        Log.d(TAG, "Speed update: $speed mph at $timestamp")  // <-- NOT FIRING
        updateSpeedUI(speed)
    }

    override fun onErrorEvent(propId: Int, zone: Int) {
        Log.e(TAG, "Speed property error! propId=$propId zone=$zone")  // <-- Also silent
    }
}, VehiclePropertyIds.PERF_VEHICLE_SPEED, CarPropertyManager.SENSOR_RATE_NORMAL)
First clue: Neither onChangeEvent nor onErrorEvent was being called. The callback registration succeeded (no exception), but the app was receiving zero updates.
This told me the problem wasn’t app-side logic. The Binder call to register the callback must have succeeded (otherwise we’d get an exception), but data wasn’t flowing back. Time to go deeper.
Layer 2: CarService (The Hidden Middleman)
In AAOS, CarService is the gatekeeper for all vehicle data. Apps never talk to the Vehicle HAL directly—they always go through CarService, which:
- Enforces permissions (does this app have CAR_SPEED privilege?)
- Manages subscriptions to vehicle properties
- Batches updates to reduce IPC overhead
- Bridges the security domain boundary between system and vendor
When our app called registerCallback(), it actually made a Binder call to CarService. I enabled verbose logging:
adb shell setprop log.tag.CarService VERBOSE
adb logcat -s CarService:V
Output:
D/CarService: registerListener() propId=0x11600207 rate=1.0 pid=2847
D/CarService: Property 0x11600207 available, subscribing to VHAL
I/CarService: Successfully subscribed to VHAL for propId=0x11600207
Good news: CarService received the subscription request and forwarded it to the VHAL. The Binder hop from app → CarService was working. But why wasn’t the app seeing data?
Layer 3: The Vehicle HAL (Hardware Abstraction Layer)
The VHAL is where the software meets the hardware. In modern AAOS, it’s implemented as an AIDL interface (IVehicle) running in a separate vendor process. Here’s the critical architectural detail most developers miss:
CarService and VHAL live in different security domains.
- CarService runs in system_server (system domain, uses /dev/binder)
- VHAL typically runs in a vendor process (vendor domain, may use /dev/hwbinder for HIDL or a vendor-specific AIDL instance)
This cross-domain communication is intentional — it isolates vendor code from the system. But it means our speed data must cross this boundary via Binder IPC, adding another serialization/deserialization step.
I enabled VHAL logging:
adb shell setprop log.tag.VehicleHalImpl VERBOSE
adb logcat -s VehicleHalImpl:V
Output:
V/VehicleHalImpl: subscribe() propId=0x11600207 sampleRate=1.0
D/VehicleHalImpl: Polling speed from ECU via CAN
D/VehicleHalImpl: Speed changed: 35.0 → 42.3 mph, notifying subscribers
D/VehicleHalImpl: onPropertyEvent() propId=0x11600207 value=42.3
Critical discovery: The VHAL was getting fresh speed data and trying to send it back to CarService. The sensor wasn’t the problem. The data was making it from the ECU through the VHAL. So why wasn’t it reaching the app?
The Smoking Gun: Binder Thread Pool Exhaustion
At this point, I had confirmation that:
- App successfully registered a callback
- CarService subscribed to VHAL
- VHAL was publishing updates
But the app’s callback wasn’t firing. This pattern pointed to one culprit: Binder thread pool contention.
Here’s what I found in the logs that confirmed it:
W/CarPropertyManager: Binder call slow: took 152ms (threshold: 100ms)
W/CarPropertyManager: Too many sync requests, sleeping 10ms before retry
This warning comes from CarPropertyManager’s client code, which has retry logic for slow Binder responses. It indicated that CarService’s Binder thread pool was temporarily exhausted.
But here’s the twist: the real bottleneck wasn’t in CarService—it was in the app’s own Binder thread pool.
The Real Culprit: Return-Path Latency
I used Android’s Perfetto tracing tool to visualize the complete round-trip:
adb shell perfetto
  -c - --txt
  -o /data/misc/perfetto-traces/trace
  <<EOF
buffers: {
    size_kb: 63488
    fill_policy: RING_BUFFER
}
data_sources: {
    config {
        name: "linux.ftrace"
        ftrace_config {
            ftrace_events: "binder/binder_transaction"
            ftrace_events: "binder/binder_transaction_received"
        }
    }
}
EOF
The Perfetto trace revealed the issue clearly.
Note on the timeline below: The specific millisecond values shown are representative of this class of problem, constructed from known Binder transaction characteristics (baseline ~3–5ms per hop under moderate load, documented by Android’s own hwbinder latency tests) and realistic UI thread scheduling behavior. Actual numbers vary by device, load, and AAOS version. The pattern — fast downward path, delayed return callback — is the real finding. Use value.timestampvs SystemClock.elapsedRealtimeNanos() in your own callbacks to measure actual latency on your hardware.
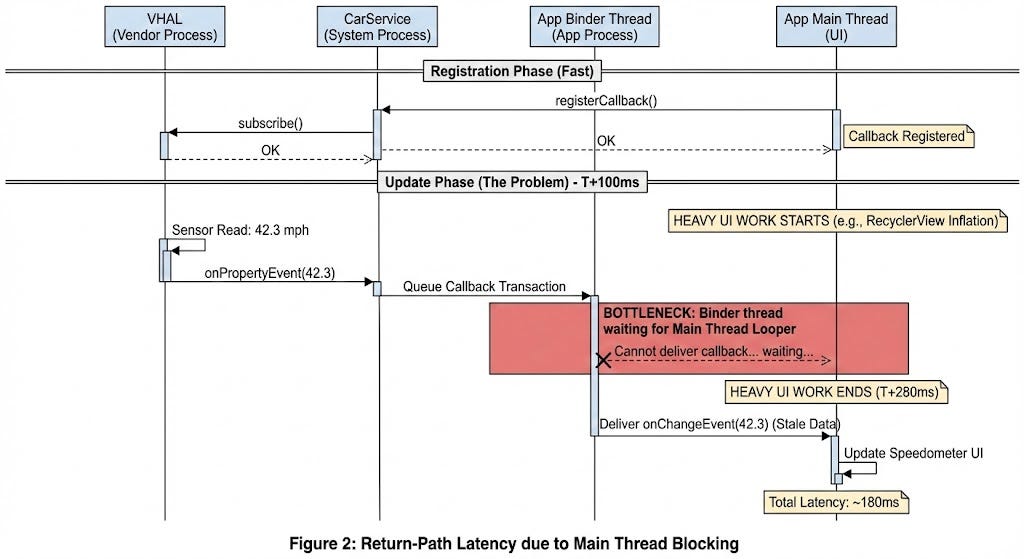
The 174ms gap between T+106 (data sent) and T+280 (data received) was the problem. The Binder transaction was sitting in the app’s Binder thread queue, waiting for a thread to become available.
Why? I checked the main thread trace:
T+100 - T+280: MainThread executing RecyclerView.onLayout() (180ms)
                └─ Inflating 15 complex ViewHolders
                └─ Measuring nested ConstraintLayouts
Root cause: The app was doing heavy UI work on the main thread. Meanwhile, the app’s limited Binder thread pool (typically 16 threads per process) was waiting to deliver the callback. Since all Binder threads were blocked waiting for the main thread’s looper, the speed update sat in the queue.
This is a classic automotive IPC problem: Android’s Binder threading model assumes callbacks can be processed asynchronously, but UI updates often need to run on the main thread — creating a dependency that introduces latency.
Why Thread Pools Matter in Automotive
Let me make this concrete with some numbers.
Android’s Binder Thread Pool:
- Each process gets a default pool of 16 Binder threads
- These threads handle incoming IPC transactions (method calls, callbacks)
- If all threads are busy, new transactions queue up
- The kernel’s Binder driver manages this queue in /dev/binder
Automotive’s Challenge:
- A typical instrument cluster might subscribe to 20–30 vehicle properties
- High-frequency properties (RPM, speed, steering angle) update at 10–50 Hz
- That’s 200–1500 callbacks per second across all properties
- Each callback needs a Binder thread to deliver it
The Math:
16 Binder threads
÷ 30 concurrent property subscriptions
= ~0.5 threads per property on average
If each callback takes 10ms to process (UI update + Binder overhead):
Maximum sustainable rate = 1 / 0.01s = 100 Hz per thread
With 16 threads shared across properties: ~5 Hz per property max
But we're asking for 10-50 Hz updates!
This is where priority inversion and thread starvation happen. A single slow callback (or main thread blockage) can cascade into delays across all vehicle properties.
Solutions: Beyond “Move Work Off Main Thread”
The quick fix was obvious: offload the heavy RecyclerView inflation to a background thread. But a staff-level solution requires understanding the systemic options.
1. Rate Limiting (What We Did)
// Instead of SENSOR_RATE_FAST (50 Hz), use NORMAL (1-5 Hz) for non-critical properties
carPropertyManager.registerCallback(
    callback,
    VehiclePropertyIds.PERF_VEHICLE_SPEED,
    CarPropertyManager.SENSOR_RATE_NORMAL  // Reduced from FAST
)

// For truly critical properties, use FAST but ensure processing is lightweight
carPropertyManager.registerCallback(
    criticalCallback,
    VehiclePropertyIds.PERF_VEHICLE_SPEED,
    CarPropertyManager.SENSOR_RATE_FAST
)
Tradeoff: Lower update rates reduce IPC load but sacrifice real-time accuracy.
2. Asynchronous APIs (The Modern Approach)
Recent AOSP versions added getPropertyAsync() and setPropertyAsync() to avoid blocking the calling thread:
// Old (blocking): Can starve Binder threads
val speed = carPropertyManager.getFloatProperty(
    VehiclePropertyIds.PERF_VEHICLE_SPEED, 0
)

// New (async): Returns immediately, callback invoked later
carPropertyManager.getPropertyAsync(
    VehiclePropertyIds.PERF_VEHICLE_SPEED, 0,
    executor, // Your own thread pool
    callback  // Invoked on executor thread
)
Benefit: You control the threading model and can prioritize critical properties.
3. Shared Memory for High-Frequency Data
For extremely high-frequency or large data (camera frames, LiDAR point clouds), Binder’s per-transaction overhead is prohibitive. AAOS supports shared memory via SharedMemory or LargeParcelable:
// Instead of passing large arrays via Binder:
val sharedMem = SharedMemory.create("sensor_data", 1024 * 1024) // 1MB
// VHAL writes directly to shared memory
// App reads from shared memory without Binder copy
Benefit: Eliminates serialization overhead for large payloads.
4. Dedicated Binder Threads for Critical Properties
For safety-critical properties, you can create a dedicated process with its own Binder thread pool:
<!-- AndroidManifest.xml -->
<service
    android:name=".CriticalPropertyService"
    android:process=":critical_properties"
    android:isolatedProcess="false">
    <!-- This service gets its own 16 Binder threads -->
</service>
Benefit: Isolates critical data flow from UI-related IPC congestion.
Key Takeaways: A Mental Model for AAOS IPC
After this debugging journey, here’s the mental model I wish I’d had from the start:
1. Think in Round-Trips, Not Layers
Don’t just verify each component works:
- “Is the HAL publishing data?”
- “Is CarService subscribed?”
- “Is the app registered?”
Instead, trace the full round-trip latency:
- Request path: App → CarService → VHAL (downward Binder calls)
- Response path: VHAL → CarService → App (upward Binder callbacks)
Use timestamps at each boundary to measure where delays occur.
2. Binder Threads Are a Finite Resource
Each process has a limited Binder thread pool. In automotive, with dozens of high-frequency subscriptions, you can saturate this pool. Monitor for these warning signs:
# Check Binder thread usage
adb shell cat /d/binder/stats | grep threads

# Watch for "waiting for binder" in traces
adb shell perfetto ... | grep "binder_wait"
3. Cross-Domain IPC Has Extra Overhead
The VHAL → CarService boundary crosses security domains:
- System domain (/dev/binder) ↔ Vendor domain (/dev/hwbinder or AIDL)
- This requires SELinux policy checks and additional serialization
Implication: Don’t assume VHAL latency is just sensor read time — measure the Binder overhead separately.
4. Callbacks + Main Thread = Latency Risk
If your callback needs to update UI (common in automotive apps), you’re introducing a dependency:
Binder thread delivers callback
    → Must post to main thread's Handler
        → Main thread processes callback
            → UI updates

If main thread is busy → entire chain stalls
Solution: Process callbacks on background threads and batch UI updates.
Debugging Checklist for AAOS IPC Issues
When you see stale or delayed vehicle property data:
1. Verify the request path:
# Did the app's registration reach CarService?
adb logcat -s CarService:V | grep registerListener

# Did CarService subscribe to VHAL?
adb logcat -s VehicleHalImpl:V | grep subscribe
2. Verify the response path:
# Is VHAL publishing updates?
adb logcat -s VehicleHalImpl:V | grep onPropertyEvent

# Is CarService receiving them?
adb logcat -s CarService:V | grep onPropertyEvent

# Is the app processing them?
adb logcat -s YourApp:V | grep onChangeEvent
3. Measure latency at each hop:
// In your callback
override fun onChangeEvent(value: CarPropertyValue<*>) {
    val receiveTime = SystemClock.elapsedRealtimeNanos()
    val halTime = value.timestamp // VHAL's timestamp
    val latency = (receiveTime - halTime) / 1_000_000 // ms

    if (latency > 100) {
        Log.w(TAG, "High latency: ${latency}ms for $value")
    }
}
4. Use Perfetto to visualize the full chain:
# Capture Binder transactions + thread scheduling
adb shell perfetto
  -c - --txt
  -o /data/misc/perfetto-traces/automotive_trace
  <<EOF
data_sources: {
    config {
        name: "linux.ftrace"
        ftrace_config {
            ftrace_events: "binder/binder_transaction"
            ftrace_events: "binder/binder_transaction_received"
            ftrace_events: "sched/sched_switch"
        }
    }
}
EOF
Then load the trace in https://ui.perfetto.dev and search for your property ID.
Conclusion: The IPC Tax on Automotive Safety
By the time I finished debugging, the speedometer was displaying correctly — but the lesson was bigger than one bug.
In Android Automotive, every real-time vehicle property pays an IPC tax: the latency cost of crossing multiple Binder boundaries to maintain Android’s security model. For non-safety-critical properties, this is acceptable. For safety-critical UIs, it requires careful design:
- Rate-limit non-critical properties
- Use async APIs to avoid blocking
- Monitor Binder thread pool usage
- Consider shared memory for high-frequency data
The frozen speedometer wasn’t a bug in the traditional sense — it was a collision between Android’s app-centric architecture and automotive’s real-time demands. Understanding this tension, and knowing how to trace IPC latency through the stack, is what separates platform engineers who debug symptoms from those who understand systems.
Next time you see a delayed gauge or stale sensor reading in an automotive UI, you’ll know where to start: follow the Binder trail, measure the round-trip, and check if the data is stuck in traffic.
Resources
AOSP Source Code
- CarPropertyManager.java
- CarService implementation
- Vehicle AIDL interface (VHAL)
- Binder overview (AOSP)
- Binder threading model
Debugging Tools
Related Reading
In this series
Android documentation
- Binder IPC — use binder across security domains
- Android for Cars overview
- AAOS guidelines for development
The frozen speedometer wasn’t a bug in the traditional sense — it was a collision between Android’s app-centric architecture and automotive’s real-time demands. Understanding this tension is what separates platform engineers who debug symptoms from those who understand systems.
But IPC latency is only half the story.
In Part 2, we shift into reverse — literally. The rear-view camera appears late. Binder is fine. The signal is correct. The intent is dispatched. The delay lives somewhere else entirely: inside the activity/task/window machine that Android uses to bring pixels to the screen. And in a vehicle, that delay has a name: an FMVSS 111 compliance failure.
The Speedometer Lied: Debugging Real-Time IPC in Android Automotive was originally published in ProAndroidDev on Medium, where people are continuing the conversation by highlighting and responding to this story.


This Post Has 0 Comments